Your threshold
Set a temperature and a duration for a local warning. This keeps a brief spike from being treated the same way as a sustained rise.
 PC HzWindows 10/11 x64
Compare the current reading with what your computer usually does under a similar load. When temperatures rise, look at which apps were using the CPU at the time.
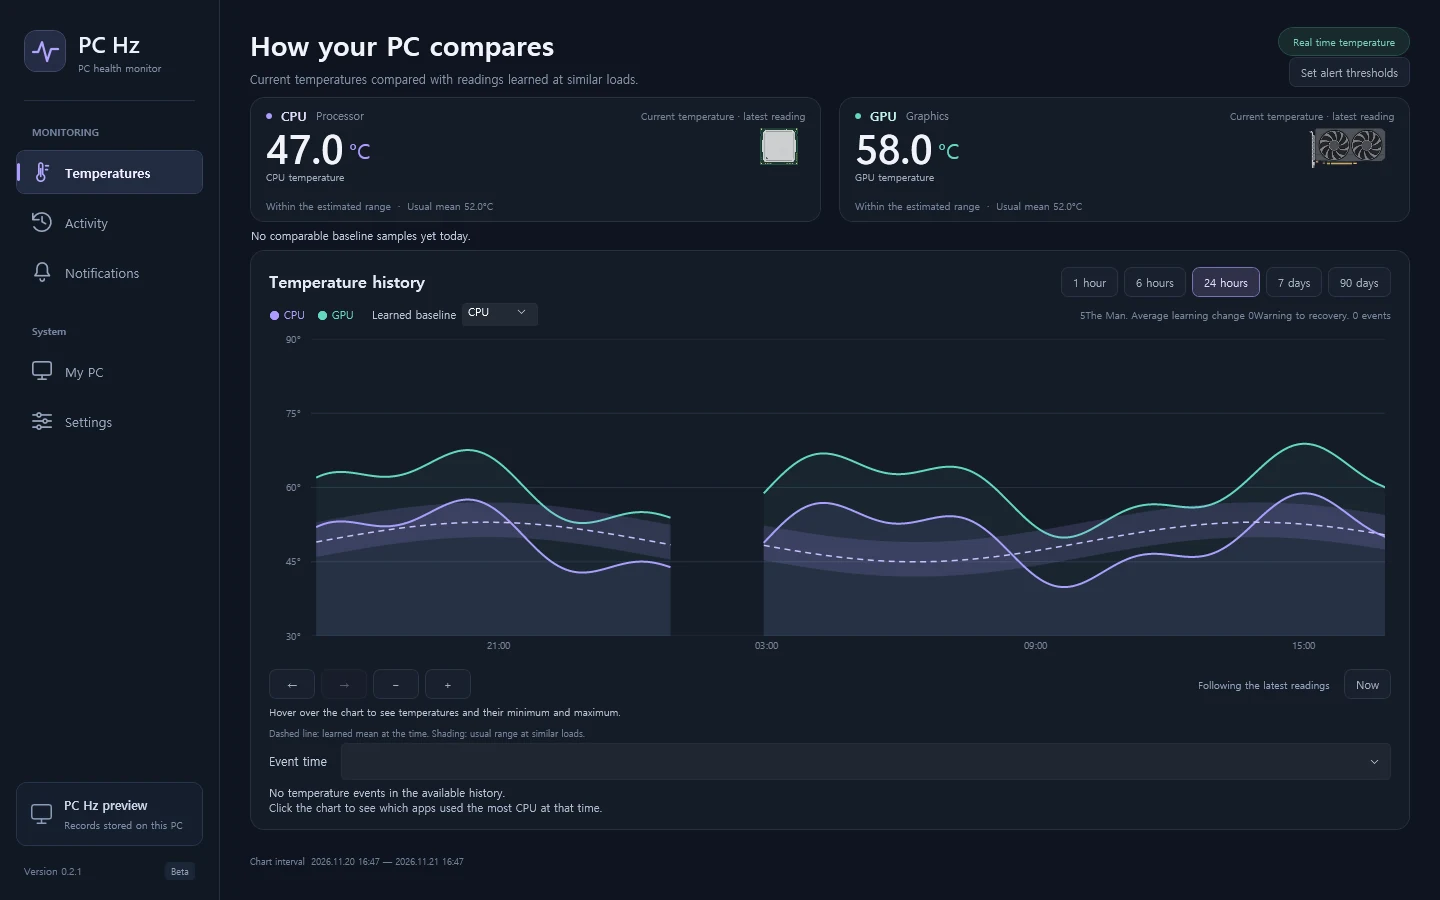
Load gives a temperature its context. Read the measurement, average and usual range together.
Hover over the single tray icon for the latest CPU and GPU readings when your sensors provide them.
Open history and choose the period you want to review. The chart reads the requested period from the local log, with up to 90 days available.
Look at today’s largest deviation above the learned range and open the CPU activity around that time. A deviation is a clue to investigate.
Set a temperature and a duration for a local warning. This keeps a brief spike from being treated the same way as a sustained rise.
The baseline shows what is usual for this PC under comparable load. It becomes more useful once the PC has collected enough comparable readings.
If you opt into Windows shutdown, the warning asks you to confirm before proceeding. Background monitoring continues from the tray.
Use Windows 10 version 2004 or later, or Windows 11, on an x64 PC. Store availability depends on your region and the publication schedule.
Available readings depend on the hardware. Some CPUs need the separate PC Hz sensor service and the PawnIO driver for package temperature. The Store app does not bundle the driver.
Temperature history, activity history and baseline learning are stored on this PC. Data is read by period when you open charts or reports.
Compare it with other sessions under similar load, and use the recorded app activity and temperatures to decide what to investigate.